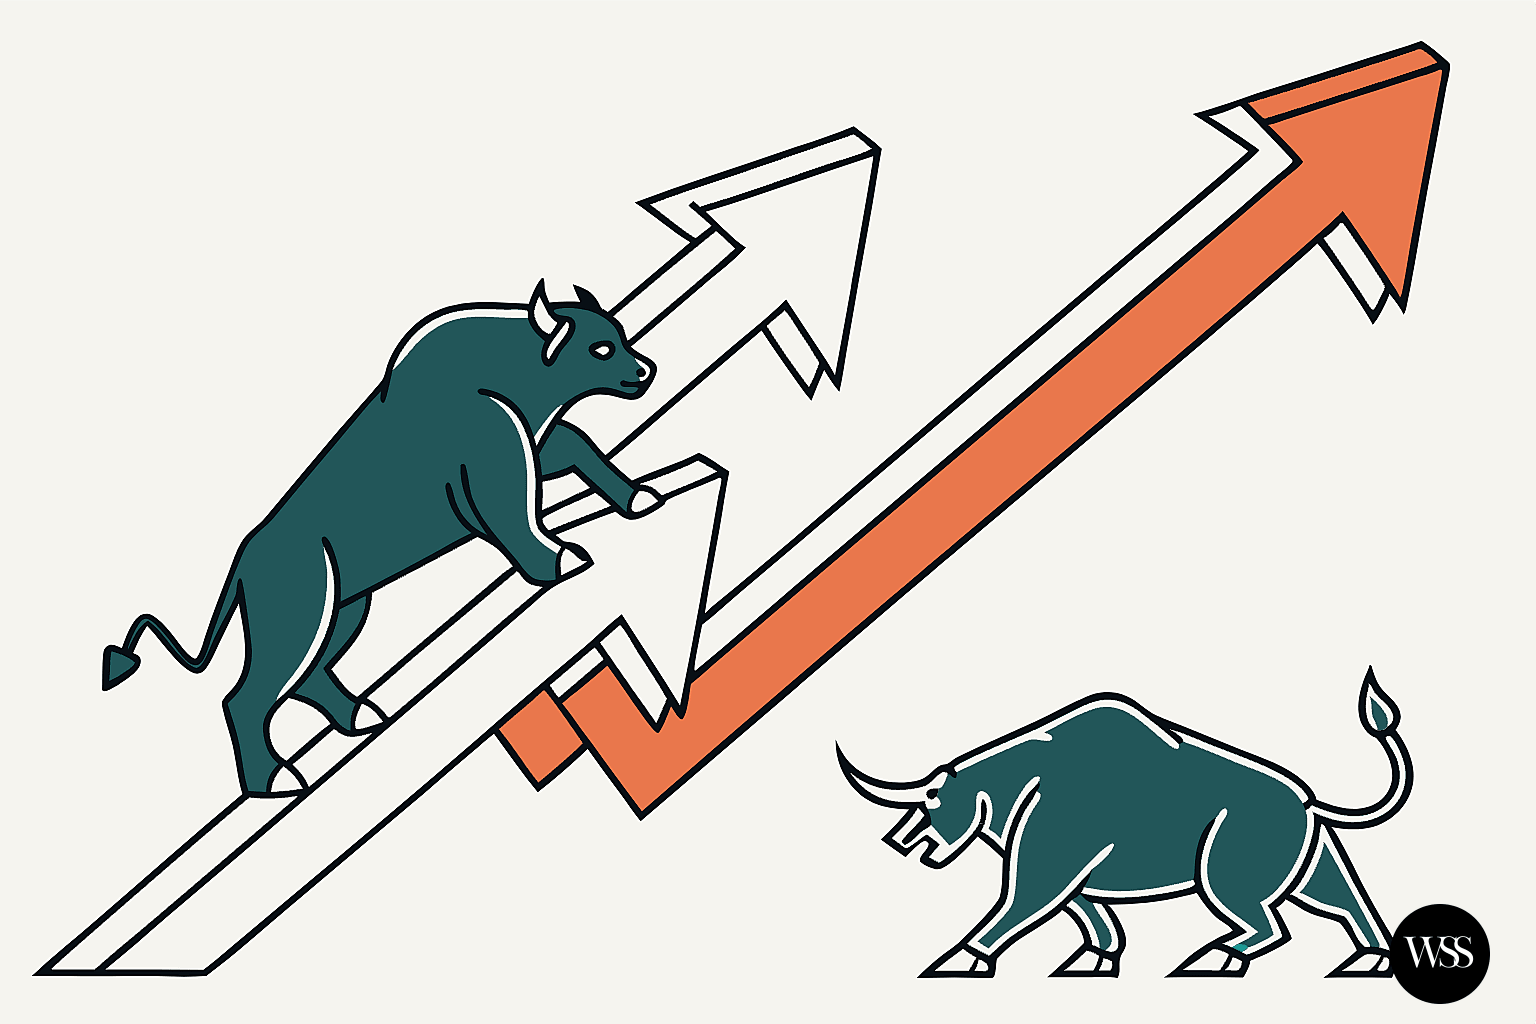
Bullish Options Signal Market Upswing Ahead
Options market data shows the most bullish sentiment since December 2020. With Q1 earnings behind us, what catalysts should investors monitor through August? Learn the key indicators that will determine if we face recession or continued growth.
The market's recent strength is undeniable, with key indices pushing higher. But let's look under the hood. The CBOE Equity Put/Call ratio, a gauge of bearish versus bullish bets, currently hovers around 0.84 on a 10-day moving average as of mid-May 2025.
This isn't the wild euphoria of late 2020; it suggests a more measured optimism, perhaps even a healthy skepticism, accompanying the rally. It’s quite something to see this climb without the options market going completely off the rails with bullish fever.
Insights
- Current market strength is notable, but options sentiment (Put/Call Ratio ~0.84) suggests measured optimism, not unbridled euphoria, indicating a rally tempered with caution.
- Key economic data releases in June and July (reflecting April/May activity) and especially August (inflation, GDP, employment trends) will be pivotal in clarifying recession odds versus a soft landing scenario.
- The Federal Reserve is widely expected to maintain current interest rates until at least September 2025, awaiting clearer economic signals, with persistent core inflation (PCE around 3.1% forecast for 2025) remaining a primary concern.
- Strategic risk management, including the use of tools like trailing stops and a focus on data-driven decision-making, is vital for navigating potential market volatility and protecting capital.
- A long-term investment perspective should account for potential market rotations (e.g., between value and growth stocks, or large and small-cap companies) and require adaptability to evolving economic conditions.
Why This Rally Makes Sense (And What It Means Now)
This current market picture makes sense if you've been tracking the underlying currents. More than a month back, the expectation here was for solid Q1 earnings. Why? January showed glimmers of hope, and March saw a notable pull-forward of business activity. This wasn't about gazing into a crystal ball; it was about understanding economic sequencing and the lag in data reporting.
We anticipated good earnings and positive Q1 data because such figures always reflect past activity. The apprehension around potential April tariffs? That actually fueled some bullishness as businesses moved to front-run those very tariffs. This isn't about some magical insight into geopolitical deals; it's about understanding basic economic cause and effect.
So, yes, the NASDAQ 100 has indeed pushed decisively above its 200-day moving average, a classic technical signal. By some definitions, that's a bull market confirmation, up over 20% from its recent lows. The S&P 500 is showing a respectable gain of around 4.5% year-to-date as of mid-May 2025, a welcome sight after earlier volatility. The Fear & Greed Index? It's flashing 'Greed,' currently around a reading of 70.
Globally, the picture is varied but with notable bright spots. Hong Kong’s Hang Seng Index is up an impressive 18% year-to-date, and Germany’s DAX is also performing strongly, up about 14%. The U.S. S&P 500, with its 4.5% year-to-date gain, is holding its own, especially considering the significant sector rotation we've witnessed as those previously high-flying tech names took a well-deserved breather from their stratospheric valuations.
This bullish sentiment gets a tailwind from corporations executing larger-than-anticipated share buybacks. A smart move on their part. Meanwhile, analysts have already started tempering expectations for Q2 earnings. Ironically, this often leads institutions to believe the worst is priced in. "Is it time to buy?" becomes the prevailing whisper.
But looking in the rearview mirror is a fool's errand. The real question is: what's next? What are the landmines we need to sidestep?
The May Lull: A Temporary Truce?
For the remainder of May, the immediate path seems less cluttered with major economic releases. Major earnings season is largely behind us. The Fed's last meeting is in the books.
The 10-year/2-year Treasury spread, a closely watched recession indicator, is currently inverted by about 35 basis points (the 2-year yield is 0.35% higher than the 10-year). While an inversion is historically a warning, the market seems to be looking past it for now, especially as it hasn't breached more extreme inversion levels recently.
Now, when markets get this confident, contrarians often start looking for cracks. But with many investors likely employing trailing stops – a risk management tool that automatically sells a security if it drops by a certain percentage from its peak – a sudden, catalyst-free mass exodus seems less probable.
So, what could disrupt this relative calm in May? The most significant risk factor on the immediate horizon is probably renewed EU tariff discussions. Tensions between the European Union and the current U.S. administration, particularly concerning Ukraine support and potential retaliatory tariffs, could certainly introduce unwelcome volatility.
We're already operating with overall tariff levels that echo the Smoot-Hawley era of the 1930s. Yes, even with some recent adjustments on specific Chinese goods, the trade environment is far from smooth.
But the direct impact of these headline tariff numbers? It's still a bit too early for that to fully bite into the real economy this month.
June and July: The Data Deluge and Economic Momentum
Come June, the strategic map gets far more complex. This is when we'll start seeing the hard data from April and May. And this is where we need to watch for what I call "Newton damage."
Newton's first law tells us an object in motion tends to stay in motion. When you disrupt consumer or business confidence, as the April tariff uncertainties did, you risk slowing economic momentum. Even if a full stall is avoided, that momentum might be significantly reduced. Instead of robust expansion, the economy might shift to a more cautious, slower pace.
The wealth effect from rising markets can offer some cushion, certainly. People see their investment portfolios grow and feel a bit more confident. But when businesses start making cuts – as some have signaled with hiring freezes or targeted reductions – they don't always reverse course and start hiring aggressively just because a trade headline changes.
When will we see this potential slowdown in the numbers? Realistically, April-May data won't fully hit the screens until early to late June. That means markets might start showing increased sensitivity to this incoming data towards the end of May or early June.
The Federal Reserve? Their next FOMC meeting is scheduled for June 17-18, 2025. And the market, according to the CME FedWatch Tool, is pricing in a mere 10% chance of a rate cut then. For July? It's around 35%. Realistically, a full rate cut isn't heavily anticipated until September. The Fed doesn't need to rush while headline unemployment data remains relatively contained.
Yes, the latest unemployment rate for April 2025 came in at 3.9%. And yes, the number of people unemployed for 27 weeks or longer has been a concern. The most recent JOLTS report showed job openings ticking down to around 8.2 million, and the quits rate, a measure of worker confidence, holding steady at a somewhat subdued 2.1%. These figures point to a labor market that is cooling, not collapsing. Not yet.
We know we're in a phase of moderating growth. The pressing question is whether it's a gentle descent or something more abrupt. Will the "Newton damage" from April's uncertainties lead to continued cutbacks by businesses and consumers? We simply won't have a clear picture until June or even July, because the Fed will also await May's comprehensive data before making significant policy shifts.
Think about any recent adjustments to trade policies. How are consumers responding? We won't know the retail sales impact for a full month post-adjustment until June's data is released in July. Some of that clarity won't even emerge until mid-August.
The Inflation Mirage and the August Reckoning
Now, consider inflation. The April 2025 Consumer Price Index data, released in May, showed headline inflation at 3.4% year-over-year, with core CPI (excluding food and energy) at 3.6%.
The so-called 'super core' inflation – which typically refers to services inflation stripping out volatile components like energy services and housing, giving a cleaner look at underlying service sector price pressures – showed a monthly annualized rate of around 4.1% for April. This indicates persistent stickiness in some areas.
Does it make sense that April's inflation figures weren't more alarming, given tariff concerns? Absolutely. Businesses likely front-loaded inventory in the preceding months to sidestep potential tariff impacts. We haven't worked through that stockpile yet.
So, the real impact of any tariff changes on consumer prices? We probably won't see that until we burn through about three months of this inventory – covering April, May, and June. This pushes the relevant CPI data out to July, which we won't get our hands on until August.
This brings me to a pivotal point: By August, we should have a much clearer picture of whether the economy is steering into a recession or navigating a soft landing.
If there's no recession, we're likely looking at a 'higher for longer' interest rate environment. For those in real estate, for example, this might mean focusing on strategies like maximizing depreciation allowances (such as Section 179 where applicable), exploring accessory dwelling units (ADUs) for additional income streams, and meticulously optimizing tax deductions. These are certainly areas many sophisticated investors are evaluating.
But what if August brings genuinely bad news? What if unemployment has spiked significantly – say, from the current 3.9% to well over 4.5% or 5% – and is clearly trending upwards? This seems less probable right now, but it's a scenario that can't be dismissed. If that happens, you're looking at a situation where the Fed is forced to pivot, and pivot hard. This is where those trailing stops become invaluable, helping to protect capital as the storm gathers.
Right now, rising stock prices and the associated wealth effect point towards 'no recession' as the more probable outcome. Does that make me an outright bull? It makes me cautiously optimistic, but with a healthy dose of 'show me the data.' I don't mind waiting until August for more definitive signals.
"Successful investing involves doing a few things right and avoiding serious mistakes."
Jack Bogle Founder of The Vanguard Group
Strategy and Perspective
So, what's the strategic approach in this environment? For many, it continues to involve the disciplined use of trailing stops. They are an excellent tool for capturing profits during momentum runs.
When that momentum eventually wanes, positions can be automatically adjusted, freeing up cash. This isn't about liquidating everything, but about actively managing risk and being prepared to redeploy capital when opportunities align with your strategy.
The interplay of economic data, sentiment, and policy creates a dynamic field of forces. The 'damage' from earlier shocks, like trade tensions or supply chain disruptions, can have lingering, often unseen, effects that ripple through the economy over time.
We also have to consider the broader investment context. For much of the last decade, U.S. large-cap stocks have significantly outperformed small caps. The Russell 2000 has lagged. Could 2025 be the year small caps begin to close that performance gap? Some analysts are making that case.
We've also seen a rotation from growth to value stocks this year as those high-flying tech and AI names corrected from what were, by many measures, very stretched valuations.
And let's not ignore what institutional researchers are observing. The Indiana Business Research Center, for instance, has noted that stocks appeared to be:
"priced for a perfect soft landing,"
Indiana Business Research Center making the market vulnerable if that narrative falters.
Their base case for 2025 was for below-average stock performance. Morningstar's team, in their recent outlooks, has put the probability of a U.S. recession this year in the 40-50% range and forecasts Personal Consumption Expenditures (PCE) inflation around 3.1% for 2025, a slight moderation but still above the Fed's target.
Their advice often leans towards a balanced approach, sometimes overweighting value and being selective with growth, citing those previously stretched tech valuations.
These aren't panic-driven headlines; they are sober assessments from serious analysts. They underscore the narrow path the economy is currently treading.
Analysis
The current market "skyrocket," as some might term it, isn't flying blind, but it's certainly navigating through some fairly thick fog. We're seeing a fascinating tug-of-war. On one side, you have strong technical momentum, decent corporate earnings, and a pervasive hope that the Federal Reserve can engineer that elusive soft landing. This is what's fueling the "greed" on the sentiment gauges and pushing indices higher.
On the other side, the "extreme" data isn't a single rogue wave; it's a confluence of crosscurrents. Valuations in certain sectors, particularly tech and AI-related stocks, had become quite extended and are still areas to watch. Inflation, while moderating from its peaks, remains stubbornly above the Fed's comfort zone, especially in core services.
The labor market is cooling – a necessary development for inflation control, but one that carries the risk of overshooting into a sharper slowdown. Add to this the persistent uncertainties of global trade policies and geopolitical tensions, and the picture becomes decidedly complex.
So, what's next? Prepare for a period of heightened data dependency. Every significant economic release – CPI, PPI, jobs reports, GDP, retail sales – will be dissected with an intensity that reflects the market's search for direction. August, as highlighted, shapes up to be a potential crucible where several of these data threads converge, offering a much clearer, albeit possibly unsettling, view of the economic trajectory.
The Federal Reserve finds itself in an unenviable position. They are attempting to thread a very fine needle: taming inflation without triggering a deep recession. Their patience will be tested, and their communication will be critical. Any hint of a policy misstep, or a surprising data print, could easily inject significant volatility.
This isn't a market for passive observation; it's one that rewards active risk management and strategic thinking. It’s less about predicting the market’s every twitch and more about preparing your portfolio for a range of plausible outcomes. The recent ascent in stock prices could prove vulnerable if the incoming data sours the soft-landing narrative. Vigilance, therefore, isn't just a buzzword; it's a necessity.
Final Thoughts
The current market optimism is tangible, and the technical momentum appears robust. But the underlying risks – trade policy nuances, the delayed impact of inflation, and potential shifts in employment data – are very real and require careful monitoring.
The next few months, leading into that August data crucible, will be pivotal. Will we witness a sustained expansion, a soft landing, or will the economic engine show more significant signs of sputtering?
My approach, and that of many seasoned investors, remains consistent: meticulously analyze the incoming data. Be prepared for various scenarios. And remember that clear thinking, backed by a solid, adaptable strategy, will always outperform decisions made in panic or under duress.
This isn't about attempting to perfectly predict every market gyration. It's about understanding the primary forces at play, managing risk prudently, and positioning yourself to capitalize on genuine opportunities as they emerge, all while safeguarding the capital you've worked hard to accumulate.
The economic and market conditions are continually evolving, and those who adapt thoughtfully are the ones best positioned to thrive over the long term.
Did You Know?
The 10-year/2-year Treasury yield spread has inverted before every U.S. recession since 1955. However, the lead time between inversion and the official start of a recession can vary significantly, sometimes by as much as two years, and an inversion doesn't guarantee a recession will follow in all economic environments.
Disclaimer: The information provided in this article is for informational and educational purposes only. It does not constitute financial advice, investment advice, trading advice, or any other sort of advice and you should not treat any of the article's content as such. The author and publisher are not responsible for any financial decisions made based on this information. Always conduct your own research and consult with a qualified financial advisor before making any investment decisions. Investing involves risk, including the possible loss of principal. Past performance is not indicative of future results.